
Integrated Annual Report
2025

IT IS MY PRIVILEGE TO REPORT ON THE GROUP'S
RESULTS FOR THE 2025 FINANCIAL YEAR.
South Africa’s
ECONOMY REMAINED WEAK THROUGHOUT
THE FINANCIAL YEAR,
Lamar Booysen
Chief Financial Officer
with low GDP growth and few signs of recovery in domestic demand
for goods and services.
Consumer confidence levels have been low, underpinned by worsening sentiment in the residential sector due to the reduction in activity. In this challenging environment, we have focused on remaining competitive and managing the aspects of our business which we can control.
The analysis below for the year ended 30 June 2025 focuses on the key elements of the Group's financial performance and statement of financial position, which management believes to be important for the understanding of the Group's performance. The review should be read together with the annual financial statements. All comparisons are against the 2024 financial year unless stated otherwise.
| 2025 | % change from 2024 |
2024 | ||
|---|---|---|---|---|
| Group and franchise results | ||||
| Turnover (Rm) | ||||
| – by Group-owned stores and entities | 8 876 | (2) | 9 064 | |
| – by franchise-owned stores | 2 383 | (4) | 2 471 | |
| System-wide turnover (Rm) | 11 259 | (2) | 11 535 | |
| Number of stores* | 210 | 1 | 208 | |
| Group results | ||||
| Turnover (Rm) | 8 876 | (2) | 9 064 | |
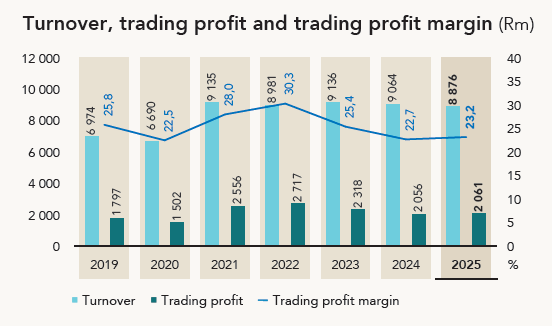
| Trading profit (Rm) | 2 061 | 0 | 2 056 | |
| Total assets (Rm) | 10 552 | (1) | 10 634 | |
| Cash and cash equivalents (Rm) | 2 169 | 18 | 1 844 | |
| Number of shares in issue ('000) | 1 321 654 | – | 1 321 654 | |
| Headline earnings per share (cents) | 125,1 | 2 | 123,0 | |
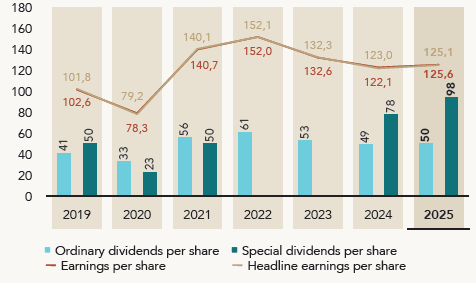
| Ordinary dividends declared per share (cents) | 50,0 | 2 | 49,0 | |
| Special dividends declared per share (cents) | 98,0 | 26 | 78,0 | |
| Net asset value per share (cents) | 705,0 | (0) | 707,5 | |
| Number of employees | 2 646 | 4 | 2 554 |
System-wide turnover for the financial year decreased by 2% versus the prior year with key factors being difficult macro-economic conditions for businesses and consumers, increased competition (retail and manufacturing) and internal inefficiencies.
Consolidated turnover of R8 876 million was 2% lower than the prior year (2024: R9 064 million) - a decline from the flat turnover recorded at half year.
Gross retail store turnover increased by 0,4% versus the prior year, while on a like-for-like basis increased by 1,3%. Overall average selling prices rose by 0,2% in the retail businesses with increases in volumes being noted for all merchandise categories except for décor, sanitaryware and wooden flooring, which decreased by 1,3%, 3,1% and 14,9% respectively.
Sales from Company-owned stores increased 2,3% for the year to date while franchise stores sales decreased 3,6%. A contributing factor was the conversion of the TopT Mopani region's stores to Company-owned stores at the beginning of the financial year. Excluding this impact, and other changes in the store mix, sales from Company-owned stores grew 0,7% while those of franchise stores' decreased 0,7%.
Sales by the Supply Chain businesses, (Cedar Point, ITD and DC), were 2,9% lower, collectively. During the prior year, price increases were passed on due to exchange rate fluctuations, higher shipping costs (which decreased from the end of the previous calendar year) and increased pricing from suppliers. These increases were delayed as long as possible to support competitive pricing at the retail level and were staggered, having a mixed impact on margins from a timing perspective. The decline in the average selling price was also impacted by changes in the sales basket mix, e.g., the move to lower-priced products as customers shopped down.
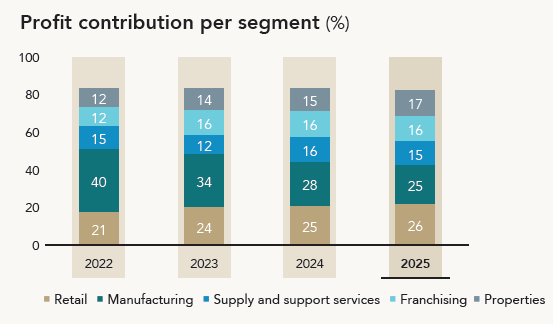
Manufacturing sales (aggregation of Ceramic Industries, Ezee Tile and PiViCal Panels) decreased by 5,1% to R4,7 billion, as volumes remained under pressure at Ceramics, which faced increased competition in the market as tiles from factories in Southern Africa continued to penetrate the local and export markets.
Due to improved production and deliveries from the Ezee Tile plants, coupled with the impact of price increases, Ezee Tile grew sales by 4,0%.
On a consolidated level, the gross margin achieved for the year remained flat at 40,6%.
The Manufacturing businesses collectively recorded a gross margin percentage decrease of 1,4% from the prior year-end, which had a significant impact on the overall Group gross margin. The biggest contributing factors that have impacted the gross margin are low factory yields and production volumes. Tile volumes in particular have come under pressure due to the competitive factors detailed above.
The Supply Chain businesses' gross margin percentages increased collectively by 0,2%. These businesses benefitted from a stronger Rand and lower shipping costs, which decreased from the end of the previous calendar year. This was offset by a change in sales mix with customers shopping down in retail stores and a higher purchase price introduced by suppliers.
The Manufacturing and Supply Chain businesses continued to limit and delay price increases, in some cases offering price reductions on tiles to retailers, to support competitive retail prices, resulting in retail margins decreasing by 0,7% on the prior year-end.
At a Group level, inventory provision income statement releases of R13 million compared to R20 million further contributed to the reduced achieved gross margin percentages detailed above. In addition, changes in the store mix (movements in sales volumes between Company-owned and franchised stores) resulted in mix changes in the intercompany sales elimination on consolidation, which may increase/decrease the margin depending on the nature of store sales mix change.
Other operating income comprises various income received from franchised stores (rental, royalties, and IT and other service fees). The income was flat as an increase in franchise agreement renewal income was offset by a decrease in clawback income year-on-year.
Operating expenses dropped by 2,8% on the prior year (the decrease is similar on a like-for-like basis). Notable movements for the prior year were recorded on the following expense items:
Per share figures (cents)
Return on shareholders' interest (%)
Trading profit was flat primarily due to decreases in gross profit net of savings in operating costs as detailed above.
Finance income increased by 4%, which is largely attributable to an increase in the average cash holdings for the year coupled with a R2 million fair value gain on the Italtile and Ceramic Foundation's investments, which are held at fair value through profit and loss.
Finance costs decreased due to the early settlement of the R500 million Nedbank loan coupled with the new drawdown facilities being only partially drawn for most of the third and fourth quarters.
The taxation expense decreased by 3% from the prior year. The lower effective tax rate is attributable to the increase in non-taxable dividend income resulting from higher average cash balances throughout the year.
Earnings from non-controlling interests increased as a result of the rise in profits of businesses with minority partners.
Earnings per share ("EPS") and headline earnings per share ("HEPS") increased to 125,6 cents and 125,1 cents respectively. The slight disparity between EPS and HEPS is attributable to after-tax profits of R7 million earned on assets sold.
A 1% decrease in the weighted number of shares from 1 198 million to 1 190 million (as a result of own share purchases during the previous year) resulted in the slightly higher increase in EPS compared to the decrease in attributable profits after tax.
Capital expenditure of R234 million was incurred on property, plant and equipment, with significant capital spend being as follows:
The Group's inventory balance net of provisions and including goods on the water decreased to R1 228 million from R1 271 million at 30 June 2024 (a decrease of 3%). On a gross basis, prior to provisions and including the goods in transit balance (R36 million at 30 June 2025 versus R33 million at 30 June 2024), total inventory holdings of R1 408 million reduced by 4,1% (2024: R1 469 million).
This decrease is predominantly attributable to a reduction in the excessive investment in stock at Cedar Point and lower stock at Ceramics.
Total inventory provisions decreased from the prior financial year end to R122 million (2024 year end: R144 million), mainly due to a lower value of finished goods at Ceramics.
The 12-month average financial stock turn has shown improvement in some businesses as a result of decreased average inventory holdings. However, this was partially offset by lower stock turn at Ceramics, resulting in an increase in Group stock turn of 3,6% to 6,5 times from 6,7 times.
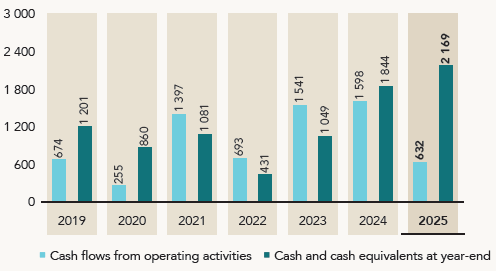
Cash flows (Rm)
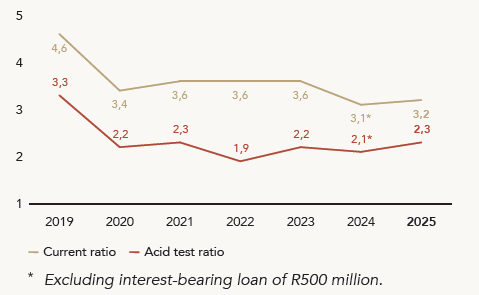
Liquidity ratios (times)
The Group's cash balance rose to R2 169 million from R1 844 million, with cash generated by operations offset by the following outflows during the year:
The 5% decrease in net trade and other receivables is attributable to a decrease in prepayments, which was increased further by timing differences on receipt of payments from debtors. Overall, there has been no noticeable deterioration in the average collection period on trade receivable balances.
The doubtful debt provision decreased to R65 million (2024: R69 million) as the provision was utilised to write off historic debts considered irrecoverable (for which provisions had been raised historically).
During the preparation of the Group's 2025 annual financial statements, and in the process of providing enhanced disclosure through further disaggregation of the credit risk note for trade receivables, the Group identified a matter relating to intercompany consolidation entries dating back to preceding financial years. This resulted in an understatement of both trade and other receivables and trade and other payables amounting to R190,5 million in each of the preceding years. The matter has been rectified in the current year's financial statements.
The 2% decrease in net trade and other payables is attributable to timing differences on payments and stock purchases.
The 2% increase in the provision balance is attributable to an increase in the rehabilitation provision of R12 million raised for the rehabilitation of the Silica Quartz sand mine acquired by the Group, net of a decrease of R8 million in the profit share provision.
Other than the dividend declaration, the directors are not aware of any matters or circumstances arising since the end of the reporting period that will significantly affect the financial position at 30 June 2025 or the results of its operations or cash flow.
The general control environment remains robust and I have no knowledge of any fraud or suspected fraud, which could have a material effect on the results of the Group.
Cash flows waterfall (Rm)

Our Information Technology ("IT") department provides critical and value-adding support across the Group to ensure optimal operational efficiencies and an exceptional customer experience. IT's role is integral to the business and the strategic projects that underpin our business model. We rely on IT for technological expertise in the fields of data and information security, data analytics, process improvements, automation, operational efficiencies and, more recently, testing the use of AI, all of which are fundamental to the IT projects undertaken.
During the 2025 financial year, we continued our relentless focus on the security of our systems, the research and adoption of innovative ways to maintain our competitive advantage, extract savings and introduce new skills and expertise.
We foresee a similar challenging economic and trading environment in the financial year ahead - including a highly competitive landscape, excess capacity and low demand as consumers continue to experience constrained circumstances. Our focus will remain on improving efficiencies across all aspects of the business, providing exceptional product ranges and an unrivalled customer shopping experience, as we defend our market leadership position.
I would like to extend my sincere appreciation to:
Lamar Booysen
Chief Financial Officer
