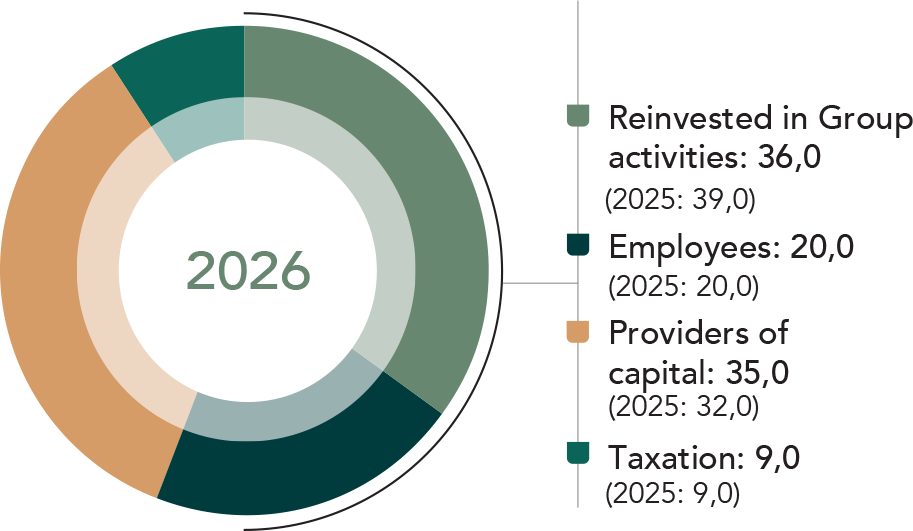
| Group | |||||
| 2026 Rm |
% | 2025 Rm |
% | ||
| Turnover and other income | 9 195 | 9 298 | |||
|---|---|---|---|---|---|
| Net cost of goods and services | (3 724) | (3 911) | |||
| 5 471 | 5 387 | ||||
| Income from investments and interest received | 127 | 125 | |||
| Value added | 5 344 | 5 262 | |||
| Value distributed and retained | |||||
| Employees | |||||
| – Salaries, incentives and benefits | 1 093 | 20 | 1 078 | 20 | |
| Providers of capital | 1 896 | 36 | 1 695 | 32 | |
| – Outside equity holders | 71 | 1 | 54 | 1 | |
| – Finance costs | 82 | 2 | 76 | 1 | |
| – Ordinary and special dividend | 1 743 | 33 | 1 565 | 30 | |
| Taxation | 504 | 9 | 462 | 9 | |
| Reinvested in Group activities | 1 851 | 35 | 2 027 | 39 | |
| – Depreciation and amortisation | 510 | 10 | 533 | 10 | |
| – Retained income | 1 341 | 25 | 1 494 | 28 | |
| 5 344 | 100 | 5 262 | 100 | ||
The Group paid
during the year to employees in the form of salaries, incentives and benefits. These employees in turn supported their families, contributing to the economic activity of their communities and the economy overall.
The Group spent a net amount
during the year purchasing raw materials and inventory as well as other products and services from suppliers. This in turn creates opportunities for suppliers to employ more staff to keep pace with the Group’s demands.
The Group paid
in taxation, for the ultimate benefit of all citizens in the territories in which it operates.