



Lamar Booysen
Chief Financial Officer
It is my privilege to report on the Group’s results for the 2026 financial year.
The operating environment remained challenging, with subdued economic growth, constrained consumer demand and intense competition across both the retail and manufacturing markets. Excess capacity and pricing pressure continued to affect tile manufacturers, while higher energy, transport and municipal costs placed further pressure on margins.
Against this backdrop, the Group remained focused on the aspects of the business within its control, including customer satisfaction, execution excellence, cost discipline, operational efficiency, inventory management and cash generation.
The analysis below for the year ended 30 June 2026 focuses on the key elements of the Group’s financial performance and statement of financial position, which management believes are important to an understanding of the Group’s performance. The review should be read together with the annual financial statements and the summarised financial information. All comparisons are against the 2025 financial year unless stated otherwise.
Group financial results summary
| 2026 | % change from 2025 |
||
| System-wide turnover | R11,3 billion | 1% increase | |
|---|---|---|---|
| Group turnover | R8,8 billion | 1% decrease | |
| Trading profit | R1,8 billion | 10% decrease | |
| Earnings per share | 113,1 cents | 10% decrease | |
| Headline earnings per share | 113,4 cents | 9% decrease | |
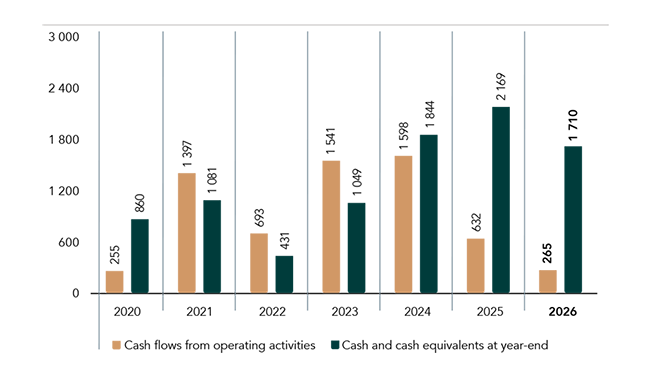
| Cash and cash equivalents | R1,7 billion | 21% decrease | |
| Net asset value per share | 653,6 cents | 7% decrease | |
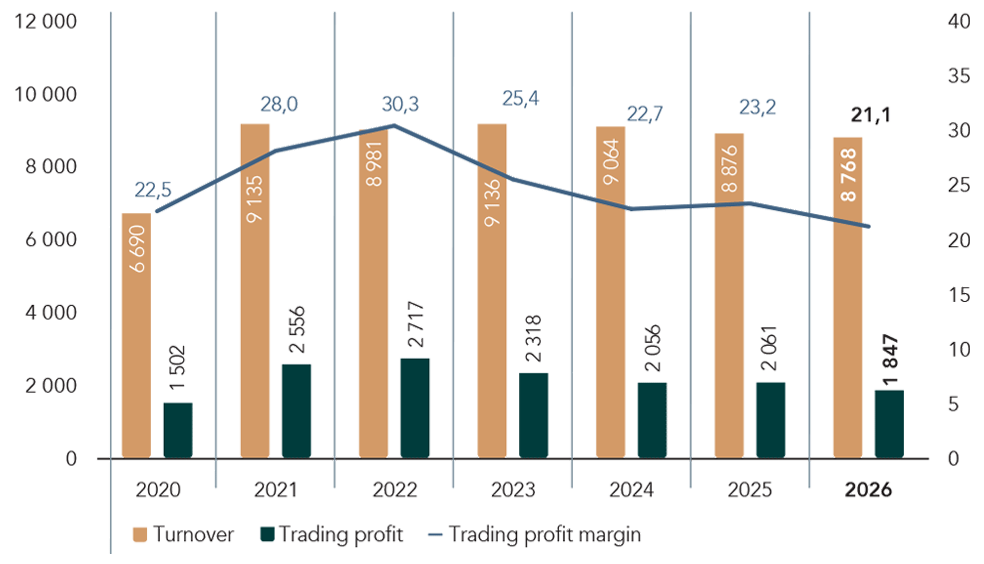
System-wide turnover increased marginally to R11,3 billion, while Group turnover decreased by 1,2% to R8,8 billion.
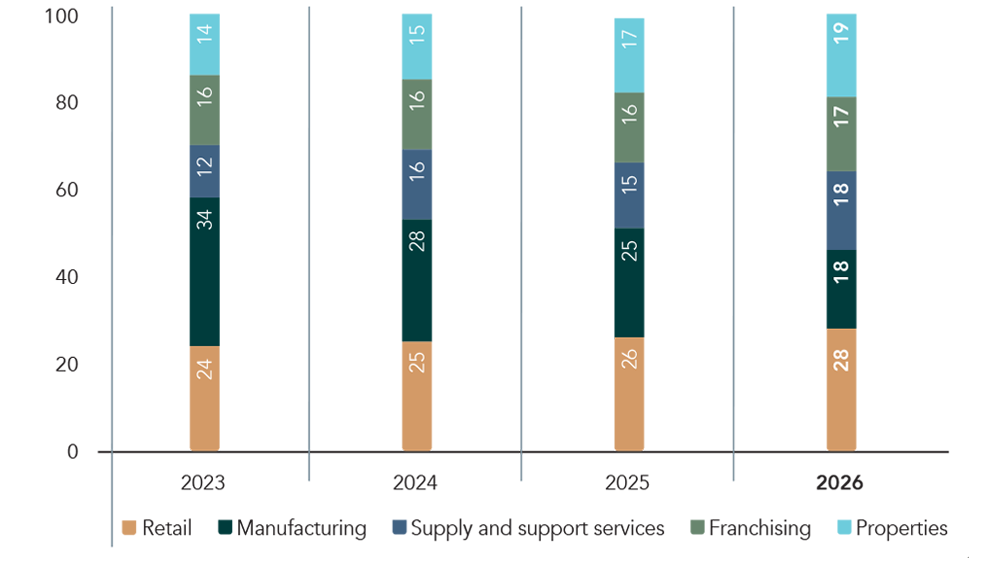
Retail system-wide turnover increased by 0,4%. Company-owned store sales decreased by 2,8%, while franchise store sales increased by 7,5%, partly reflecting changes in the store mix. Excluding store conversions and other mix changes, Company-owned store sales decreased by 0,5% and franchise store sales increased by 2,4%. The Group’s store network increased to 213 stores. Online sales increased by 8,9%, raising their contribution to retail sales from 2,5% to 2,7%.
The supply chain import businesses reported lower turnover as retail businesses sold through existing stock and adjusted sourcing arrangements. Gross margins improved through favourable buying practices and exchange-rate benefits.
Manufacturing sales decreased by 1,2% to R4,7 billion. Ceramic Industries’ sales decreased by 1,1%, with volumes approximately 4% lower. Performance was affected by intensified competition, imported product, pricing pressure, weaker export demand, higher operating costs and lower capacity utilisation. Ezee Tile remained resilient, with stable revenue and improved raw material margins despite increased demand for entry-level products.
The Group’s achieved gross margin decreased from 39,9% to 38,9%. The reduction was mainly attributable to lower manufacturing volumes and yields, pricing pressure, higher production costs and the effect of reduced capacity utilisation at Ceramic Industries.
Retail margins improved through better purchasing, favourable exchange rates and disciplined pricing execution. The benefits achieved in the retail and supply chain businesses were insufficient to offset the pressure experienced in manufacturing.
Other operating income comprises various income received from franchise stores, including rental, royalties, IT fees and other service fees. The movement for the year should be considered together with changes in the number and mix of franchised stores and franchise agreement renewal activity.
Management maintained a strong focus on cost discipline throughout the year. Excluding the Australian adjustments, like-for-like operating expenses increased by 1,2%.
The principal cost pressures included manpower, transport, fuel, gas, municipal charges, utilities and depreciation arising from capital investment. These increases were partially mitigated by productivity initiatives, procurement benefits, tighter discretionary expenditure and continued scrutiny of the Group’s cost base.
Trading profit decreased by 10,4% to R1,8 billion. The decline was primarily attributable to lower manufacturing profitability, increased input costs and once-off adjustments recognised in Ceramic Australia, partly offset by improved retail margins and disciplined cost management.
Finance income reduced in line with the decline in average cash holdings during the year.
Finance costs were affected by interest arising in Ceramic Australia in respect of late payment of employee taxes and the unfavourable Weston matter, partially offset by lower interest rates on Group facilities.
The effective tax rate remained broadly aligned with the prior year, with the decrease in the taxation expense corresponding to the reduction in profit before tax.
Earnings attributable to non-controlling interests were in line with the prior year.
Where minority equity partners have received funding from the Group to acquire shares and are required to sell their shares back to the Group should their employment end, the arrangements are accounted for in terms of IFRS 2 and no non-controlling interest is recognised until the relevant funding has been settled. Following settlement of the funding provided to certain minority equity partners, the Group commenced recognising the related non-controlling interests.
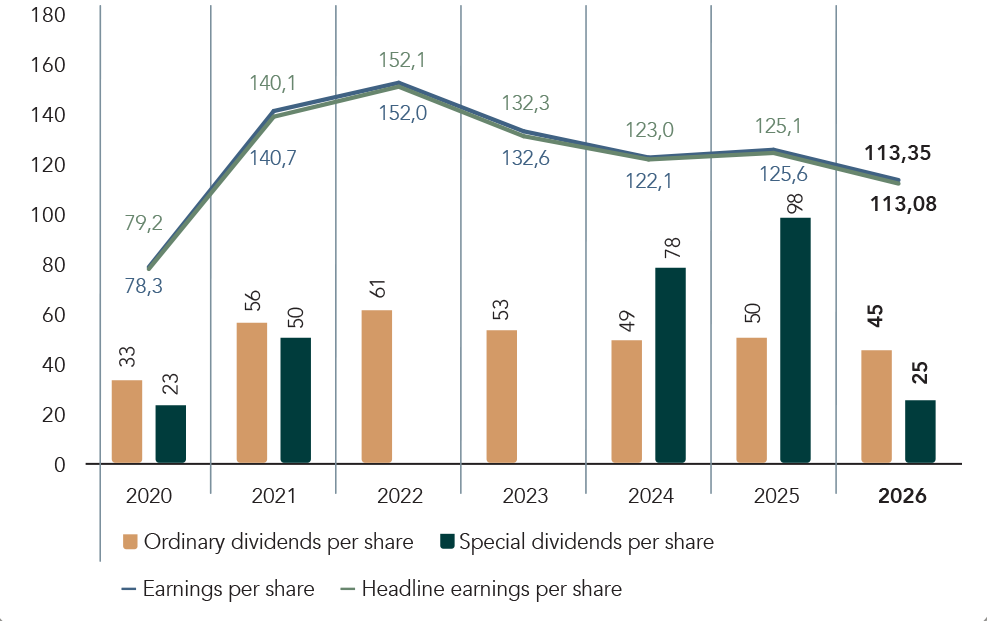
Earnings per share (“EPS) and HEPS decreased to 113,1 cents and 113,4 cents respectively. The slight disparity between EPS and HEPS is attributable to after-tax profits of approximately R2 million on assets disposed of during the year.
The weighted average number of shares in issue decreased to approximately 1,19 billion shares following share repurchases during the year.
Property, plant and equipment
Capital expenditure of R443 million was incurred on property, plant and equipment. Significant expenditure included:
Capital allocation remains subject to disciplined review, with a continued focus on returns, strategic relevance and cash generation.
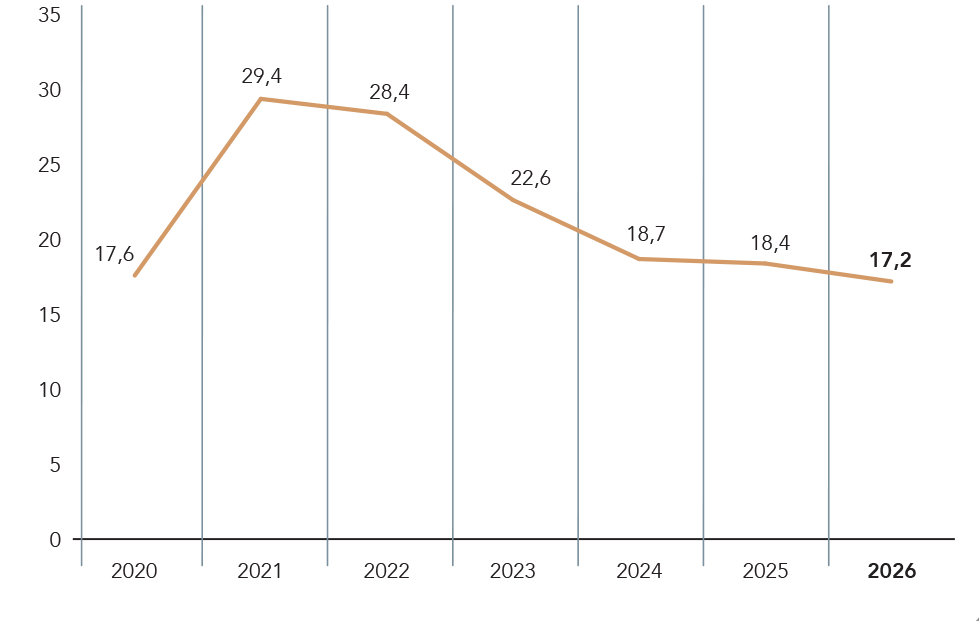
The Group’s inventory balance, net of provisions and including goods on the water, decreased by 2,9% to R1,2 billion. Management continued to focus on improving stock turn, reducing excess holdings and aligning inventory with demand across the retail, supply chain and manufacturing businesses.
Approximately 71% of the Group’s procurement was sourced locally, supporting shorter supply chains and the Group’s vertically integrated business model.
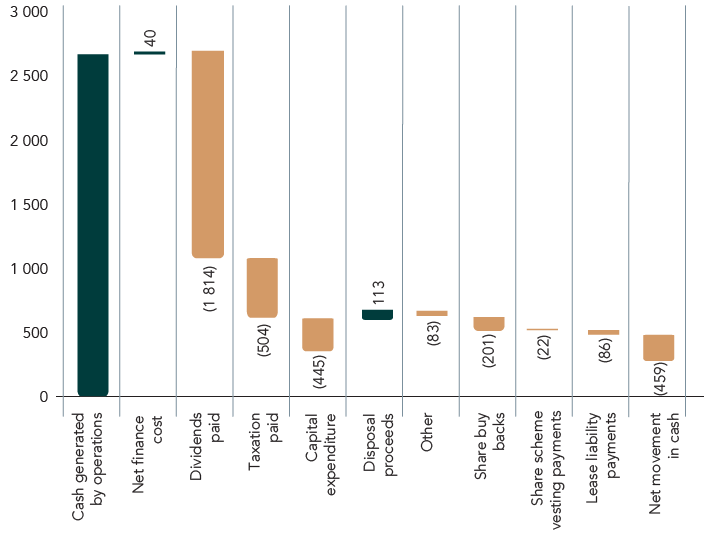
Cash and cash equivalents decreased to R1,7 billion. Cash generated from operations was offset by:
The Group retained a strong balance sheet and sufficient liquidity to support operations and approved investment requirements.
Trade and other receivables were managed closely during the year. Management continued to monitor debtor ageing, collection trends and the adequacy of expected credit-loss provisions across the Group.
Movements in trade and other payables were primarily influenced by the timing of supplier payments and stock purchases. The Group remains focused on maintaining appropriate supplier terms while supporting working-capital efficiency.
The Group continued to assess the adequacy of provisions at year-end, including inventory, rehabilitation, employee-related and other operational provisions, based on the information available at the reporting date.
In the weak trading environment, National Ceramic Industries Australia (“Ceramic Australia”) grew sales steadily; however, profitability was impacted by historical expenses recognised in the current year. During the first half of the year, management identified an inconsistency in the business’s internal monthly reporting. A completed forensic investigation found intentional manipulation of results by the individual responsible for the accounts, with no evidence of asset misappropriation. The full financial impact was recognised in the current year and no prior‑period adjustment was required.
Given the significant capital expenditure incurred and the business’s weak performance, the Group provided additional funding of AU$4,5 million during the year. The Group continues to review its presence in Australia and discussions with a prospective purchaser remained in progress at year-end.
The directors are not aware of any matters or circumstances arising since the end of the reporting period which will significantly affect the Group’s financial position at 30 June 2026 or the results of its operations or cash flows for the year then ended, other than matters disclosed in the annual financial statements.
The Group continued to focus on strengthening its financial and operational control environment. The matters identified in Ceramic Australia received particular attention, with remedial actions implemented and monitored through the Group’s governance structures.
Management remains committed to improving accountability, segregation of duties, reporting discipline and the timely remediation of control findings across the Group.
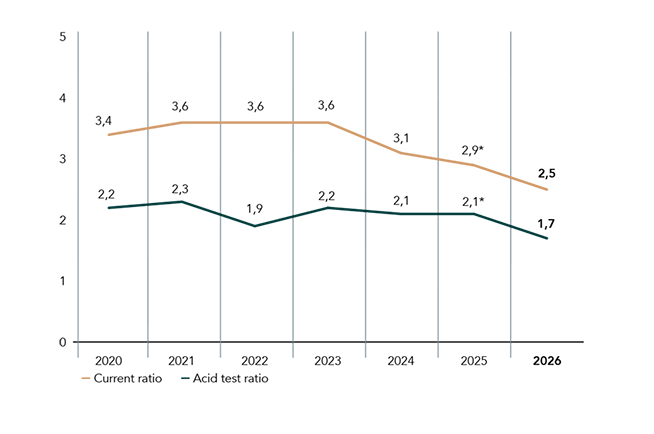
* Excluding interest-bearing loan of R500 million.
IT remains integral to the Group’s operating model and the strategic projects which support it. The Group relies on IT for data and information security, analytics, process improvement, automation and operational efficiency.
During the year, the Group continued to invest in the security and resilience of its systems, data governance and the targeted deployment of digital and AI-enabled solutions. The focus remains on initiatives that improve customer experience, productivity, decision making and control.
We anticipate that the economic and trading environment will remain challenging in the year ahead, with intense competition, excess manufacturing capacity, constrained consumer demand and ongoing cost pressure. Our focus will remain on improving efficiencies across the business, strengthening cash generation, optimising inventory, delivering relevant product ranges and providing an exceptional customer experience as we defend and grow our market position.
I would like to extend my sincere appreciation to our shareholders for their constructive engagement and support; our customers for their continued loyalty to our businesses and brands; our management and staff for their determination and commitment; our finance teams for producing sound financial information and reports; and our directors for their counsel and guidance.
Lamar Booysen
Chief Financial Officer

