


Value added statement
| Group | |||||
| 2021 Rm |
% | 2020 Rm |
% | ||
|---|---|---|---|---|---|
| Turnover | 9 135 | 6 690 | |||
| Cost of goods and services | (4 738) | (2 752) | |||
| 4 397 | 3 938 | ||||
| Income from investments and interest received | 57 | 74 | |||
| Value added | 4 454 | 4 012 | |||
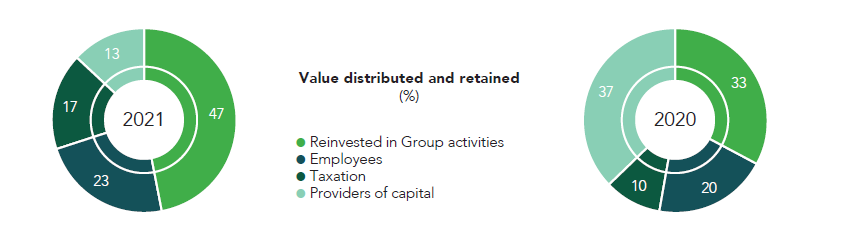
| Value distributed and retained | |||||
| Employees | |||||
| – Salaries, incentives and benefits | 1 055 | 24 | 790 | 20 | |
| Providers of capital | 559 | 13 | 1 481 | 37 | |
| – Outside equity holders | 69 | 2 | 33 | 1 | |
| – Ordinary and special dividend | 490 | 11 | 1 448 | 36 | |
| Taxation | 738 | 16 | 416 | 10 | |
| Reinvested in Group activities | 2 102 | 47 | 1 325 | 33 | |
| – Depreciation | 384 | 8 | 361 | 9 | |
| – Retained income | 1 718 | 39 | 964 | 24 | |
| 4 454 | 100 | 4 012 | 100 | ||
Indirect impacts
The total economic impact of an organisation includes indirect impacts. These are usually benefits arising in the course of its business to which a monetary amount is not directly attributable. Italtile does not assess and quantify its indirect economic impacts although the Group does provide indirect economic benefits.
- The Group spent R4 738 million (2020: R2 752 million) during the year purchasing raw materials and inventory as well as other products and services from suppliers. This in turn creates opportunities for suppliers to employ more staff to keep pace with the Group’s demands.
- During the year the Group paid R738 million (2020: R416 million) in taxation, for the ultimate benefit of all citizens in the territories in which it operates.
- The Group paid R1 055 million (2020: R790 million) during the year to employees in the form of salaries, incentives and benefits. These employees in turn supported their families, contributing to the economic activity of their communities and the overall economies.