


OUR PERFORMANCE
Chief Financial officer's report


Brandon Wood, Chief Financial Officer
FINANCIAL RESULTS
The analysis below for the year ended 30 June 2021, focuses on the key elements of the Group’s financial performance and statement of financial position which management believe to be important for the understanding of the Group’s performance. The review should be read together with the annual financial statements and the summarised financial information.
Turnover
System-wide turnover for the year to June 2021 increased by 25% as a result of strong sales growth in the retail, supply chain and manufacturing divisions. The sales growth has been driven by various factors which played out to the Group’s advantage during the year, including:
- Shift in spend and increase in share of wallet as consumers spent less on travel, leisure and entertainment as a result of the pandemic and related restrictions.
- Consumers are spending more time at home (including working from home) and this "cocooning" has increased the need and/or desire to improve living and working spaces.
- Challenges in imports (congestion at ports locally and internationally, and shortages of containers), weak exchange rates and significant increase in container and shipping costs drove up demand on our integrated manufacturing businesses.
- The Group’s retail stores have been in a much better position with regards to stock holding than competitors during most of the year (particularly those very dependent on imports).
- The low interest rate environment (which is expected to continue for at least another year with incremental increases) has stimulated activity in the property sector, which by extension results in renovation spend.
In addition, the hard lockdown in South Africa commenced on 27 March 2020, impacting the sales figures in the base (no sales recorded) and inflating growth year on year for all divisions. This had a significant impact in comparability of results for the financial year.
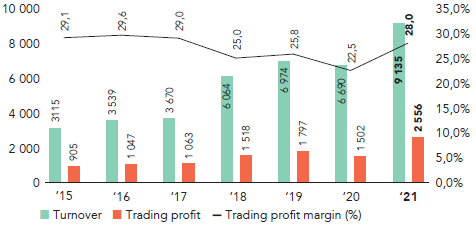
Consolidated turnover was 37% higher when compared to the prior year (R9.1 billion vs R6.7 billion) as a result of growth as detailed above as well as the inclusion in consolidated turnover of stores acquired in the prior year (in particular the TopT Limpopo, North West, Free State and Northern Cape Regions, the CTM North West region and other acquired CTM stores such as CTM Port Elizabeth). The conversion of some of these underperforming franchise regions resulted in significant sales growth, demonstrating the importance of adequate stock investment in stores (poor stock holdings had undoubtedly contributed to the poor performance in these regions during the previous year), presentation and display instore, and performance management of staff (including regional managers).
Retail
Retail store turnover increased 26% versus the prior
year, with the like-on-like increase amounting to 23%.
Strong growth was recorded by all brands during
the period. When compared to the 2019 financial
year (given distortion in the base attributable to the
national lockdown in the prior year), retail store turnover
increased 22% versus the 2019 year, with the like-on-like
increase amounting to 16%.
CTM recorded gross and like-on-like sales growth of 24% versus the prior year (versus 2019: 19% and 15%). Encouragingly, webstore sales growth remained robust at 33% for the period as more customers migrated to the online offering as a result of the lockdown (this is expected to be a permanent change in consumer behaviour). As noted above, the conversion of the CTM North West region, resulted in significant sales growth in this previously underperforming region.
Turnover, trading profit and trading profit margin
Return on shareholders' interest

| * | Excluding interest bearing loan of R500m |
Italtile Retail recorded gross and like-on-like sales growth of 37% and 31% versus the prior year (versus 2019: 20% and 12%). This growth despite its Projects division declining by 2% on the prior year as commercial developments were hard hit by the economic conditions and lockdown in South Africa. Consumer sentiment of higher LSM customers which was depressed during the prior year, improved throughout the 2021 financial year end (which became evident from June 2020), contributing to the recorded sales growth. The volume contribution of locally produced tiles to sales continues to increase in this business. The store opened in Gaborone continues to trade very well, demonstrating potential for the brand in other markets.
TopT recorded growth of 26% for the period, with a like-on-like increase of 19%. As noted above, regions acquired back from franchisees (Limpopo and North West) have shown significant improvement.
U-Light recorded sales growth of 96% for the period and like-on-like sales growth of 22%. Overall, the sales performance of the business was disappointing. Much needs to be done to improve sales (including revisiting pricing, range, staffing and presentation and display which is currently underway with good progress being made), and with effect from the end of March 2021, the business has a new Managing Director and minority shareholder (with previous minority shareholders exiting).
Supply chain
Supply chain business (Cedar Point, ITD and DC) sales
were 42% higher than the prior year. The sales increases
of the different businesses during the period were as
follows:
- ITD: 33%
- Cedar Point: 42%
- DC: 47%
Sales grew by 37.5% on those recorded in the 2019 financial year.
All businesses benefitted from the increase in demand at retail level and price increases which had to be passed on due to exchange rate fluctuations and increased shipping costs (particularly Rand weakness directly attributable to the pandemic). These increases were staggered throughout the period having a mixed impact on margins from a timing perspective.
Full sales growth potential was not realised during the first half as a result of significant delays with import of inventory due to foreign supply and port delays (the business critical in-stock positions of ITD and Cedar Point in particular being negatively impacted). Delayed shipments were received from the third quarter and as a result, sales growth accelerated from that point (particularly for DC). An improvement in global supply chains is not expected for some time, and the Group has accordingly increased import volumes to cater for such (see inventory section), and where possible local supply is being actively pursued.
Manufacturing
Manufacturing sales (aggregation of Ceramic Industries,
Ezee Tile and PiViCal Panels) for the period increased
by 35% compared to the prior year. As detailed above,
this increase in sales has been driven by a surge in
retail demand (both by the Group’s stores and industry
competitors), but certain of the factories have also
benefitted from improved production efficiencies
(particularly those of Ezee Tile).
Sales grew by 23% on those recorded in the 2019 financial year.
Ceramic Industries recorded improved yields and benefitted from range rationalisation. The Australian factory has recorded robust growth as it grows its customer base in Australia and the home improvements industry experiences an increase in demand similar to the Group’s other markets.
Gross margin
On a consolidated level, achieved gross margin improved to 44% from 38% in the prior year. Favourable margin growth was enjoyed by all divisions:
- retail margins improved 1% as a result of improved pricing ladders and strategy (particularly on tiles) and a benefit of price increases passed prior to increase in purchasing cost from suppliers. The increase was slightly offset by increases in stock provisions as a result of increased stock holdings;
- manufacturing margins improved by a significant 7% as a result of various factors including improved yields, full capacity utilisation, reduced input costs (including EcoTec technology which has reduced cost of manufacture on these thinner tiles), price increases and reduced distribution costs for the supply chain businesses. The increase is distorted by the impact of the lockdown in the prior year; and
- within the supply chain businesses, margins of ITD and DC improved collectively by 1% as a result of range rationalisation, timing impact of price increases (as noted above, although the impact thereof was different for the businesses) and savings realised on distribution costs as a result of the improved planning (fleet and routes) and consolidation of loads between Cedar Point, Ceramic Industries and DC (as part of the logistics project currently underway). These increases in margin were offset by a large decrease in the margins at Cedar Point which reduced as price increases were purposefully not congruent with increases in purchasing costs to preserve retail pricing.
Other revenue and operating income
Other operating income comprises various income received from franchised stores (predominantly rental, royalties, and IT fees). The decrease is attributable to the acquisition of various franchise stores/regions as noted above, the impact of which was slightly offset by the like-on-like growth in sales recorded by franchisees. The decrease in other operating income is itself offset by the inclusion of overall income related to the stores acquired from franchisees.
Operating expenses
Operating expenses increased by 27% from the prior year. The largest increases were noted on the following expense items:
- manpower (including share-based payments and profit share) costs included in operating expenses increased 30% mainly as a result of franchise store conversions to company owned and a significant increase in profitability of stores due to improved margins and productivity. On a like-on-like basis and excluding profit share, manpower costs included in operating expenses increased by only 4%. Manpower costs (including profit share) related to Ceramic Industries and Ezee Tile (included in the cost of sales line) increased 22% – excluding profit share, the increase was 10%. In total, profit share of R222.1 million was accrued for as at 30 June 2021 for the Group, an increase of 146% from the prior year;
- JV profit share increased 79% from the prior year to R53.3 million as result of the increase in JV partners in the retail stores and increase in the store profitability per above;
- stock control costs increased 64% from the prior year as a result of franchise store conversions to company owned, increased display costs (increased rotation of product given high demand) and increased stock holding overall. The increase on a like-on-like basis is disappointing and focus is being placed on such, although elevated stock levels place upward pressure on stock control costs;
- property costs excluding IFRS 16 adjustments increased 19% from the prior year to R179 million as a result of franchise store conversions to company owned and increase in municipal rates (in excess of inflation). The increase on a like-on-like basis was 12%; and
- depreciation, excluding IFRS 16 adjustments, included in operating expenses increased by 14% from the prior year to R86.4 million as a result of store conversions and capital expenditure (including store revamps). The increase on a like-on-like basis was 6%.
On a like-on-like basis (stripping out new and acquired owned stores, JV and staff profit share, and costs related to BBBEE) operating costs increased by 10.1%. When factoring in the impact of the lockdown in the prior period (some variable costs not incurred), the likeon- like increase in costs was approximately 9%.
Cashflows

Liquidity ratios

| * | Excluding interest bearing loan of R500m. |
Trading profit
Trading profit for the period increased by 70% from the prior year as the increase in turnover and gross margin percentage, although slightly offset by the decrease in other operating income detailed above, was greater than the increase in operating costs. Profit on disposal of assets of R19 million was recorded during the period (R15 million of which related to disposal of two properties); a significant increase on the profit recorded in the prior year of R1 million. Further, total impairments of R10 million were recorded during the year on the Ceramic Industries support centre building and PiViCal Panels machinery (in the prior year a R16 million impairment was recorded on machinery in the Samca floor factory given the pending upgrade at that point).
Finance income
Finance income decreased by 23% from the prior year which is largely attributable to the decrease in the prime rate from the prior year (10% to 7%) which was offset by an increase in average cash holdings for the year.
Finance costs
Finance costs decreased by 27% from the prior year. The figure includes finance costs of R30.4 million relating to the IFRS 16 accounting of leases (2020: R26.4 million). Excluding the impact of IFRS 16, finance costs decreased by 47% from the prior year given the decrease in lending rates detailed above and repayment of the R250 million revolving credit facility (which was outstanding in the prior year).
Earnings per share
Earnings per share ("EPS") and headline earnings per share ("HEPS") increased to 140.7 cents and 140.1 cents respectively. A 0.8% decrease in the weighted number of shares from 1 231 million to 1 221 million shares resulted in the slightly higher increase in earnings per share compared to the increase in attributable profits after tax.
Dividend per share
The Group maintained a dividend cover of 2.5 times for the year, resulting in the declaration of a final dividend of 25c per share, which together with the interim dividend totals a full year dividend of 56 cents per share, an increase of 70% from the prior year (2020: 33 cents).
In addition, in light of the Group’s strong cash generative nature and cash reserves being in excess of operational requirements, a special cash dividend of 50,0 cents per share has been declared for the year (2020: 23,0 cents per share). This is the fourth special dividend paid in four consecutive financial years.
Property, plant and equipment
Capital expenditure of R1 025 million was incurred during the period, with significant capital spend as follows:
- Betta robotic warehouse: R11 million;
- Samca factory: R262 million;
- Ezee Tile factory: R29 million;
- Boksburg retail node: R95 million;
- Zambia property purchase: R60 million;
- Australia factory upgrades and capex: R36 million;
- South African factory upgrades and capex: R62 million;
- retail buildings (new, extension and renovations): R160 million; and
- store revamps: R71 million.
Impairment
During the year the following impairments were
recorded:
- an impairment of R4 million on a building used for administration purposes which was deemed unsafe for use (structurally unsound) and demolished; and
- an impairment of R6 million on equipment at PiViCal Panels which is not fit for purpose and/or damaged, and requires replacement (by year-end, various components had already been replaced).
In the prior year, equipment and machinery at the Samca floor tile factory with a carrying value of R16 million was impaired, following a decision to upgrade the factory. The impairment was recorded as the components were deemed to have negligible recoverable amounts as they could not be reused elsewhere or sold to third parties.
IFRS 16
IFRS 16, which the Group adopted in the 2019 financial
year, introduces a single, on-balance sheet lease
accounting model for lessees. A lessee recognises
a right-of-use asset representing its right to use the
underlying asset and a lease liability representing its
obligation to make lease payments.
The Group elected to apply the modified retrospective approach which requires the recognition of the cumulative effect of initially applying IFRS 16 as of 1 July 2018 to the retained earnings. The Group has also elected not to recognise right-of-use assets and lease liabilities for short-term leases and leases of lowvalue assets – a practical expedient contained in IFRS 16.
The following balances and charges have been recognised by the Group for the 2021 financial year with the net income impact being R15 million reduction in earnings (2020: R10 million):
- Statement of Financial Position:
|
R426 million |
|
R82 million |
|
R400 million |
- Statement of Comprehensive Income:
|
R85 million |
|
R70 million |
|
R30 million |
Inventory
The inventory balance of the Group net of provisions and including goods on the water (DC goods in transit) has increased to R1 164 million from R896 million at 30 June 2020 (an increase of 30%). On a gross basis (prior to provisions) and excluding new stores (i.e. like-on-like basis) and the goods in transit balance (R99.8 million at the end of the period versus R79.6 million as at 30 June 2020), total inventory increased by 28%. This increase was predominantly attributable to deliberate investment in stock at stores (to support sales) and the supply chain businesses (to counter potential supply disruptions in future given the current challenges in the global supply chain). Timing of import stock receipts has also resulted in a year-on-year increase – many delayed shipments were received in June, increasing stock holding in the supply chain businesses and stores.
Total inventory provisions increased by 38% from the prior financial year end to R216.8 million. The unrealised profit provision at period end increased by 38% to R113.5 million (2020 year end: R82.2 million) as a result of the increased gross margin achieved by the supply chain and manufacturing businesses as well as the increase in number of corporate stores (i.e. an increase in unrealised profit in inventory holdings to be provided for), and increase in total stock holding in the retail stores. An increase of R20.8 million in obsolescence provision was recorded given higher stock levels.
The 12-month average financial stock turn of all businesses improved on prior year, with the exception of Ezee Tile, when adjusted for the month of April 2020 when no trade occurred. Overall Group turn improved by 15% to 7.3 times from 6.4 times.
Cash and cash equivalents
The Group’s cash balance increased to R1 081 million from R860 million as at 30 June 2020, with significant cash flows for the year being:
- capital expenditure of R1 025 million;
- tax payments of R738 million;
- dividend payments of R559 million; and
- own share purchases by the Group and Foundation Trust totalling R184 million.
Interest-bearing loans
An interest-bearing loan of R500 million is repayable in full on 29 November 2021, and as such, has been disclosed as a current liability as at 30 June 2021. The Group intends to refinance the facility for a further three years and is in negotiations in this regard.
Trade and other receivables
The 4% increase in net trade and other receivables from the prior financial year end is largely attributable to an increase in sales over the period (there has not been any noticeable deterioration in average collection period).
The doubtful debt provision has increased by 17% from the prior financial year end to R63 million, as the provision was increased to cater for potential losses attributable to the economic impact of the pandemic and lockdowns.
Provisions
The 132% increase in the provision balance is directly attributable to a 148% increase in the incentive bonus/profit share provision to R166.4 million from R67.3 million at 30 June 2020. This increase is a result of the improvement in Group profitability and increase in company owned stores as detailed above. In addition, a rehabilitation provision for quarries is now disclosed as part of provisions and totals R18.2 million.
Covid -19
During the fourth quarter of the prior financial year, trading in the Group’s operations ceased for a fiveweek period as a result of the national lockdown brought about by the Covid-19 pandemic. During this time, the Group incurred losses as it was unable to trade and profits remained suppressed thereafter as activities resumed incrementally with the phased relaxation of regulated restrictions. During the final month of the prior financial year, much improved trading results and profit growth were achieved. The Group has since experienced robust demand for its products and recorded increased turnover and profitability.
To date, the pandemic has not had a materially adverse effect on the collection of receivable balances due to the Group. No material impairments directly attributable to the pandemic have been recorded, and the Group remains a going concern.
SOCIAL UNREST
During the social unrest in July 2021 experienced in Gauteng and KwaZulu-Natal (“KZN”), the Group closed all of its 18 stores in KZN for 10 days, as well as 16 stores in other hotspots for shorter periods of time. Although trade was disrupted and two of the Group stores looted, the Group was fortunate to not experience material loss during this time. Business interruption and asset loss insurance claims have been lodged with insurers.
EVENTS AFTER REPORTING DATE
The founder and non-controlling shareholder in Ezee Tile Adhesive Manufacturers Proprietary Limited (“Ezee Tile”), Mike du Plessis, retired with effect from 1 July 2021. As a result, the Group acquired his shareholding in Ezee Tile for R120 million subsequent to year end, increasing the Group’s stake in this company to 97,54%.
The directors are not aware of any other matters or circumstances arising since the end of the reporting period which will significantly affect the financial position at 30 June 2021 or the results of its operations or cash flow for the year then ended.
INTERNAL CONTROL ENVIRONMENT
The general control environment remains robust and I have no knowledge of any fraud or suspected fraud which could have a material effect on the results of the Group.
INFORMATION TECHNOLOGY
Value delivery is an integral part of our IT journey to ensure a memorable customer experience from a technology point of view, and to ensure operational efficiencies throughout our business. Key operational areas of focus, outside of cybersecurity, which is core to all IT related processes, are as follows:
- Analytics: real time actionable insights for management and business stakeholders.
- Automation and Integration of systems and processes to streamline operations.
- Mobility: back office and sales processes to increase productivity.
Over the next financial year, we will place increased focus on the general control environment of our information technology systems and processes and will continue with our innovation journey which provides us with competitive advantage in various operational areas.
APPRECIATION
The period under review has exceeded our expectations and we are grateful for all achieved during the year. Personally, I would like to extend my sincere appreciation and gratitude to:
- our shareholders for the engagements and support over the year;
- our customers for their continued support of our business and brands;
- our management and staff for determination and commitment to ultimately deliver a world class shopping experience and manufacturing process;
- our finance teams for delivery of sound financial information and reports; and
- our Chairman and CEO for their inspirational leadership and consistent drive to improve.
BG Wood
Chief Financial Officer