


Chief Financial Officer's report


Brandon Wood, Chief Financial Officer
It is a privilege for me to report on the Group's financial results for the 2022 financial year. Despite a challenging operating environment, the Group has managed to grow profits off the very high base recorded for the 2021 financial year during which the Group experienced significant growth due to the boom in home improvements brought on by the pandemic.
The analysis below for the year ended 30 June 2022 focuses on the key elements of the Group's financial performance and statement of financial position which management believes to be important for the understanding of the Group's performance. The review should be read together with the annual financial statements on page 162 to 228 and the summarised financial information presented below and on Seven-year review and Value added statement.
FINANCIAL RESULTS
Group financial results summary
| 2022 | %change from 2021 |
2021 | ||
|---|---|---|---|---|
| Group and franchise results | ||||
| Turnover (Rm) | ||||
| — by Group-owned stores and entities | 8 981 | (2) | 9 135 | |
| — by franchise-owned stores | 2 364 | (3) | 2 427 | |
| System-wide turnover (Rm) | 11 345 | (2) | 11 562 | |
| Number of stores* | 211 | 2 | 206 | |
| Group results | ||||
| Turnover (Rm) | 8 981 | (2) | 9 135 | |
| Trading profit (Rm) | 2 717 | 6 | 2 556 | |
| Total assets (Rm) | 8 749 | 2 | 8 607 | |
| Cash and cash equivalents (Rm) | 431 | (60) | 1 081 | |
| Number of shares in issue ('000) | 1 321 654 | — | 1 321 654 | |
| Headline earnings per share (cents) | 152,1 | 9 | 140,1 | |
| Ordinary dividends declared per share (cents) | 61,0 | 9 | 56,0 | |
| Net asset value per share (cents) | 575 | 4 | 554 | |
| Number of employees | 2 652 | 1 | 2 613 |
| * | Includes webstores. |
Turnover, trading profit and
trading profit margin (Rm)

Profit contribution per segment (%)

Turnover
System-wide turnover for the year decreased 1,9% as a result of muted sales growth, with key factors being:
- a slowdown in the pandemic-induced home improvement boom, with the broad reopening of various sectors in the economy;
- improved in-stock positions at competitors;
- new entrants and increased competition in the market;
- the social unrest and riots in KZN and parts of Gauteng in July 2021;
- floods experienced in KZN in April 2022;
- supply chain challenges on imported stock and raw materials;
- increases in the prime lending rate and rising inflation have reduced consumer disposable income and affordability of products; and
- failure by the business to capitalise on all opportunities during the year.
Consolidated turnover was 1,7% lower at R8 981 million for the year (2021: R9 135 million) as a result of the sales slowdown detailed above as well as the inclusion of consolidated turnover in additional company-owned stores acquired toward the end of the previous financial year and during the current year (resulting in increased sales elimination entries on consolidation).
Retail
Gross retail store turnover for the year increased 2,8% versus the prior year, with the like-on-like increase amounting to 1,2%. Double-digit sales growth was recorded by Italtile Retail and U-Light during the year, while CTM recorded flat sales versus the prior year. Overall average selling prices increased 7,8% in the retail businesses with decreases in volumes on the prior year recorded for most merchandise categories.
Company-owned stores' growth for the year was 5,4% while franchise stores' sales decreased 2,6% year-on-year. The weaker performance of many of the CTM franchised stores has resulted in clawbacks being charged for the year as detailed later in this report.
Supply chain - import businesses
Supply chain business (Cedar Point, ITD and DC) sales were collectively 2,4% lower than the prior year, with the average selling price increases for the businesses in the high single digits. Price increases had to be passed on to retail stores due to exchange rate fluctuations, increased buying prices and shipping costs. These increases were delayed for as long as possible to support competitive pricing at the retail level and ranged between 5% and 20% in aggregate. These increases were staggered during the prior and current financial year, having a mixed impact on margins from a timing perspective.
Supply chain - manufacturing
Manufacturing sales (aggregation of Ceramic, Ezee Tile and PiViCal Panels) increased by 1,7% in the prior year to R5,1 billion (2021: R5,0 billion). Factors impacting sales growth included annual shutdowns commencing again in the current year (these did not take place in the prior year due to unprecedented demand), loadshedding, commissioning of Samca+ and availability of imported raw materials.
Similar to the supply chain businesses, muted sales performance by the Group's retail brands has impacted the sales of both Ceramic and Ezee Tile.
Gross margin
On a consolidated level, achieved gross margin for the year improved to 45,8% from 44,1% in the prior year. Favourable margin growth was enjoyed by the import businesses and the retail segment. The import business achieved gross margin percentage improved collectively by 0,3% as a result of range changes, product mix and timing impact of price increases. The retail segment's achieved gross margin percentage improved by 0,3% as improvements were made in price ladders and pricing increases were passed onto customers.
Manufacturing achieved gross margin percentage decreased by 1,1% from the prior year. Ezee Tile's margin was significantly impacted by the change in sales mix (increase in sales volume of lower priced, lower margin product) and significant increases in input costs (imported raw material input costs and dryer fuel price increases). Ceramic recorded a slight decrease in margin due to increased input costs (energy and imported raw materials), and lower production volumes and yields.
The adverse impact of the above on the achieved gross margin of the manufacturing businesses was partially offset by certain reduced input costs (including EcoTec technology which has reduced the cost of manufacture, packaging and transport on these thinner tiles), price increases passed to customers and reduced distribution costs as detailed later in this report.
At a Group level, a decrease in the total inventory provision income statement charges for the year has also contributed to the increase in achieved gross margin percentage. The increase in the prior year was attributable to the increase in-stock holdings in the 2021 financial year (up 30% from the previous year) - the current year increase has not been as significant and as the Group stock holding reduces, this inventory provisioning will unwind. In addition, savings recorded on sales distribution costs attributable to further implementation of the TMS have also positively impacted the gross margin. Lastly, changes in the store mix (movements between company-owned and franchised stores) result in mix changes in the intercompany sales elimination on consolidation which may increase or decrease the margin dependent on the nature of store mix change.
Other operating income
Other operating income comprises various income received from franchised stores (including rental, royalties, and IT fees). The increase in income is attributable to an increase in IT fee percentage during the current financial year as well as clawbacks recorded for the year. These clawbacks have been charged in accordance with CTM franchise and JV agreements which enable the Group to recover lost turnover-related income when budgeted sales figures are not achieved. Where appropriate, relief is provided (for example, for KZN franchisees and JV partners to accommodate for unrest and floods). The total clawback income for the year is in contrast to a rental rebate accrued for in the prior financial year as franchisees exceeded budget.
Operating expenses
Operating expenses were flat on the prior year. Notable cost movements for the year versus the prior year were as follows:
- Manpower costs (including share-based payments and profit share) included in operating expenses decreased 2,1% mainly as a result of annual salary increases (approximately 6%) which have been offset by a 25,8% decrease in the profit share accrual and a 13% decrease in share-based payment expenses. On a like-for-like basis and excluding profit share, manpower costs included in operating expenses decreased by 2,6%. Manpower costs including profit share related to Ceramic and Ezee Tile (included in the cost of sales line) increased 3,1% - excluding profit share, an increase of 5,8% was recorded. In total, Group profit share accrued for the year decreased by 17,3% from the prior year total (thus a significant contributor to the year-on-year decrease in costs).
- JV profit share decreased 8,8% from the prior year. The increase in the number of JV partners in the retail stores was offset by application of the clawback terms of the JV agreements. The royalty portion of these clawbacks is recorded in other income, while a portion related to the profit share of the JV partners is recorded as a reduction in operating costs.
- Stock control costs increased by 2,0% from the prior year in the retail stores and import businesses. Elevated stock levels place upward pressure on stock control costs, although store disciplines with regard to stock controls required attention (and improvements were achieved). On a like-for-like basis, stock control costs decreased 1,9%.
- The doubtful debt provision charge decreased 41,1% from the prior year during which charges were recorded as the doubtful debt provision was increased to cater for potential losses attributable to the economic impact of the lockdown.
- Property costs included in operating expenses (excluding IFRS 16) increased 6,1% on the prior year on a like-for-like basis, mainly attributable to the annual increase in municipal charges.
- Depreciation (excluding IFRS 16) included in operating expenses increased by 26,6% from the prior year as a result of store conversions and capital expenditure (including store revamps). The increase on a like-for-like basis was 26,1%. Returns on spend are not currently in accordance with expectations and capital expenditure for the 2023 financial year will be reduced. Depreciation of the manufacturing businesses included in cost of sales increased 5,5% for the year, also due to capital expenditure during the current and prior year.
- Travel and related expenses increased 36,8% for the year as lockdowns and travel restrictions were eased and/or lifted.
- IT costs decreased by 12% from the prior year as cost savings were realised on renegotiation of fees and early settlement of subscriptions.
- Despite significant increase in fuel prices, net distribution costs of Ceramic and Ezee Tile (included in operating expenses) increased by only 2% as a result of savings achieved through TMS and lower volume of goods moved.
Per share figures (cents)

Return on shareholders’ interest (%)

Trading profit
Trading profit increased by 6% from the prior year as the increase in gross margin percentage was supplemented by the increase in other operating income and flat operating costs. These increases have been slightly offset by the net impact of a decrease in profit on disposal of assets and impairment charges from the prior year.
Finance income
Finance income decreased by 32% from the prior year, largely attributable to a decrease in the average cash holdings for the year as a result of the significant cash outflows (including the payment of a special dividend in September 2021).
Finance costs
Finance costs increased by 7% from the prior year. Although debt balances and leasing arrangements remained fairly consistent for the year, escalations in lending rates as a result of the increase in the prime rate, have increased finance costs. The figure includes finance costs of R29 million relating to the IFRS 16 accounting of leases (2021: R30 million).
Non-controlling interest
Earnings attributable to non-controlling interests have decreased by 33% from the prior year, this being attributable to the purchase of the non-controlling interest in Ezee Tile (on the founder's retirement) and repurchase of vested retention share awards in Ceramic.
Earnings per share
Earnings per share ("EPS") and headline earnings per share ("HEPS") increased to 152,0 cents and 152,1 cents respectively from the prior year.
A 0,3% decrease in the weighted number of shares from 1 221 million to 1 217 million shares (as a result of own share purchases during the previous and current financial years) resulted in the slightly higher increase in earnings per share compared to the increase in attributable profits after tax.
HEPS growth is higher given profits on asset disposals of R19 million and impairments of R10 million in the prior year versus profits on asset disposals of R1 million and impairments of R2 million in the current year.
Property, plant and equipment
Capital expenditure of R1 024 million was incurred during the year, with significant capital spend being as follows:
- Samca+ factory: R108 million;
- Betta robotic warehouse: R101 million;
- Ceramic support centre building: R21 million;
- Ezee Tile Vulcania factory: R153 million;
- Other South African factory upgrades and capex: R161 million;
- Boksburg retail node: R66 million;
- CTM Pinetown, CTM Brits, CTM Brackenfell and Italtile Umhlanga building upgrades: R53 million;
- CTM Protea Glen, CTM Mthatha, and CTM Walmer new builds: R71 million;
- CTM and Italtile Airport Junction (Gaborone) property purchases: R52 million;
- Other retail buildings spend (extensions and renovations): R127 million; and
- Retail store shopfit revamps: R101 million.
Inventory
The inventory balance of the Group net of provisions and including goods on the water (DC goods in transit) has increased by 10% to R1 286 million from R1 164 million at 30 June 2021. On a gross basis, prior to provisions and the goods-in-transit balance (R65 million at 30 June 2022 versus R100 million as at 30 June 2021), total inventory holdings increased by 11% versus the prior year (R1 530 million versus R1 381 million).
This increase is predominantly attributable to elevated stock levels at stores (which included a deliberate investment in inventory to support anticipated sales) and increased stock levels at supply chain import businesses to counter global supply disruptions. Ezee Tile made significant investment in foreign raw materials to secure supply but has also had to contend with significant price inflation of these raw materials (given global shortages and high shipping costs). Ceramic's stock levels increased from the prior year as import raw material costs increased (and additional investments were made in such to mitigate supply issues), clay stockpiles were increased, and finished goods inventory increased on the prior year (when product demand was higher).
Total inventory provisions increased by 12% from the prior financial year end to R243 million (2021: R217 million). A conservative increase in the obsolescence provision was recorded given the high stock holding in the retail stores and supply chain businesses (the quality of inventory held has improved with most of the additional inventory investment being in business-critical stock). The unrealised profit provision at year end increased by 14% to R129 million (2021 year end: R113 million) as a result of the increase in the number of corporate stores and total inventory holding in the retail stores.
The 12-month average financial stock turn of all businesses decreased from the prior financial year end average as a result of increased inventory holdings and lower sales growth. The average Group stock turn reduced by 9,7% to 6,5 times from 7,2 times at the previous financial year end.
Cash and cash equivalents
The Group's cash balance at year end decreased to R431 million from R1 081 million as at 30 June 2021, with significant cash flows for the year being:
- capital expenditure of R1 024 million;
- dividend payments of R1 404 million;
- acquisition of the minority interest in Ezee Tile for R120 million;
- purchase of vested retention shares by Ceramic for R118 million; and
- tax payments of R755 million.
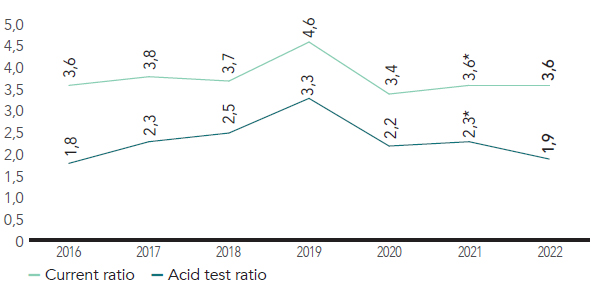
Liquidity ratios (times)
Cash flows (Rm)

| * | Excluding interest-bearing loan of R500 million. |
Trade and other receivables
The 5% increase in net trade and other receivables from the prior financial year is due to an increase in the third-party trade-receivable balances (excluding franchisees) attributable to timing differences on payment receipts. Overall, there has not been any noticeable deterioration in the average collection period.
The doubtful debt provision decreased slightly to R61 million from the prior financial year-end balance of R63 million. In the prior year, the provision was increased to cater for potential losses attributable to the economic impact of the pandemic and lockdowns, and provisioning has remained at these conservative levels.
Trade and other payables
The 27% decrease in net trade and other payables from the prior financial year is attributable to:
- a decrease of R66 million in foreign supplier balances at Ceramic. With the completion of the Samca+ factory during the year, related foreign supplier balances were settled;
- a decrease in the goods-in-transit accrual for finished goods of R34 million year-on-year;
- the prior year payable balance included a rental rebate accrual due to franchisees for exceeding sales budget, while at the current year end a clawback receivable has been recorded due to shortfalls to budget; and
- timing differences on trade payable payments.
Provisions
The 12% decrease in the provision balance is directly attributable to a 17% decrease in the total Group profit share provision from the prior year. This decrease is a result of the payment of record profit share at the end of September 2021, and February 2022, with the provision being reduced accordingly. Profitability is flat year-on-year, thus the provisions raised in the current year have not offset the payments made.
Cash flow waterfall (Rm)

Interest-bearing loans
The increase in interest-bearing loans to R552 million from the previous financial year-end balance of R507 million is attributable to an additional R45 million drawdown on facilities for property development in East Africa. This facility is repayable in October 2022 and is thus reflected as a current liability. The R500 million facility which was due in November 2022 was refinanced and is now due for settlement in November 2024 (it is therefore reflected as non-current at year end, whereas it was reflected as current in the prior year).
COVID-19
During the prior financial year, the Group experienced robust demand for its products as the home-improvement industry's share of wallet was elevated, given that various other sectors of the economy experienced restricted trade. As lockdown restrictions eased, this demand has tapered off, with the continued impact of the pandemic being a disruption to global supply chains.
To date, the pandemic has not had a materially adverse effect on collection of receivable balances due to the Group, no material impairments directly attributable to the pandemic have been recorded, and the Group remains a robust going concern.
SOCIAL UNREST AND FLOODS
During the social unrest in July 2021 experienced in Gauteng and KZN, the Group closed all of its 18 stores in KZN for 10 days, as well as 16 stores in other hotspots for shorter periods of time. Although trade was disrupted and two of the Group stores looted, the Group was fortunate not to experience material loss during this time. Business interruption and asset loss insurance claims have been finalised with insurers.
Flooding in April 2022 caused extensive damage to the Ezee Tile operation in KZN and the CTM Prospecton store, the largest of the Group's stores in the region. The insurance claim related to flood damage of assets and business interruption totalled R20 million. The claim is being finalised with insurers, and an interim payment of R7 million had been received by year end.
The resilience and determination of our teams in KZN has been truly inspirational and we salute them.
EVENTS AFTER REPORTING DATE
Subsequent to year end, the Group is still awaiting an announcement from NERSA and Sasol regarding a potential increase in pipeline gas prices. A significant increase is likely to have an impact on affordability of product, as well as on manufacturing margins. The announcement is the subject of review by relevant industry authorities and finality on the matter is expected in due course.
The directors are not aware of any other matters or circumstances arising since the end of the reporting period which will significantly affect the financial position at 30 June 2022 or the results of its operations or cash flow for the year then ended.
INTERNAL CONTROL ENVIRONMENT
The general control environment remains robust and I have no knowledge of any fraud or suspected fraud which could have a material effect on the results of the Group.
IT
Value delivery is an integral part of our IT journey to ensure a memorable customer experience from a technology point of view, and operational efficiencies throughout our business. The role of the Group's IT department is to create a vision and roadmap of strategic projects that support the Group's business strategy. Tangible benefits such as data and information security, cost reduction, process improvement, automation, improved data acquisition and overall business efficiency are critical to all projects undertaken by the Group's IT department.
During the 2022 financial year, we improved the general control environment of our IT systems following successful migration to the cloud of our database and systems. Over the next financial year we will continue with our innovation journey which provides us with competitive advantage in various operational areas and improves on the security of our IT systems where possible.
APPRECIATION
Following the highs of the previous year, the performance of the year under review has been satisfactory although short of our ambitious targets. The external environment continues to present challenges to the Group, but as is customary, we have and will continue to focus on the internal levers and opportunities within our control to extract market share gains and growth. This is not possible without the efforts of the dedicated teams throughout our business.
Personally, I would like to extend my sincere appreciation and gratitude to:
- our shareholders for the engagements and support over the year;
- our customers for their continued support of our business and brands;
- our management and staff for determination and commitment to ultimately deliver a world-class shopping experience and manufacturing process;
- our finance teams for delivery of sound financial information and reports;
- our previous CEO, Jan Potgieter, for his phenomenal leadership and mentorship;
- our new CEO, Lance Foxcroft, for the smooth leadership transition, and his inspirational and exciting perspectives on the business;
- our non-executive directors for their sound guidance and support; and
- our Chairman for his inspirational leadership and consistent drive to improve.
B G Wood
Chief Financial Officer
